Lloyd Quantization
An optimal quantization of a density
For fixed positions, the transport from the Diracs to
which decreases
sdot.quantization
x = sdot.quantization( target, 1000 )   # 1000 Diracs, starting uniformly at random in the support
x = sdot.quantization( target, x0 ) # or from given positionstarget: any distribution (ConvexHull,SumOfGaussians,Image, ...);- the starting point: either a number of Diracs, drawn uniformly at random in the support of
target(seedmakes the draw reproducible), or the positions themselves,[ n, d ], in any framework (NumPy, JAX, PyTorch, CuPy) — the result comes back in the same one; masses(optional): the mass of each Dirac, kept during the iterations — equal by default;periodicity(optional): Lloyd on a quotient space, a torus, a Klein bottle... (see Periodicity). The returned positions stay next to where they started, possibly outside the support;target_mass(optional): the share oftargetthat the Diracs take, as a partial transport —1by default;radial_func(optional): a radial integrand around each Dirac, as inOtProblem(for instancesdot.RadialExp( eps )).
The iterations stop when the root mean square move of the Diracs is below tol times tol = 2e-2, means the Diracs move by less than a fiftieth of a cell: the eye no longer sees anything. It takes about 20 iterations on the examples below; halving tol roughly doubles that. max_iter (200 by default) bounds the number of iterations.
Each iteration re-solves a transport, but the problem is kept between iterations: the previous weights are a very good starting point, and only a few Newton steps are needed.
To follow the iterations, pass a callback( iteration, positions, plan ). This is how the animations below were recorded:
history = []
x = sdot.quantization( target, 1000, callback = lambda it, pos, plan: history.append( pos ) )
Uniform density on a pentagon
1000 Diracs, starting uniformly at random in the pentagon.
import numpy as np
import sdot

angles = np.pi / 2 + 2 * np.pi * np.arange( 5 ) / 5
target = sdot.ConvexHull( np.stack( [ np.cos( angles ), np.sin( angles ) ], axis = 1 ) )

x = sdot.quantization( target, 1000, seed = 0 )Use the slider at the top of the viewer (or the play button) to go through the iterations.
A sum of three Gaussians
In 2D
2000 Diracs. support_sigmas = 3 truncates each Gaussian at three standard deviations: this is the domain of the transport.
centers = np.array( [ [ -0.5, -0.3 ], [ 0.5, -0.2 ], [ 0.0, 0.5 ] ] )
target = sdot.SumOfGaussians( centers, sigmas = np.array( [ 0.25, 0.15, 0.2 ] ),
                              weights = np.array( [ 1.0, 0.6, 0.8 ] ), support_sigmas = 3 )

x = sdot.quantization( target, 2000, seed = 0 )In 3D
Nothing changes but the dimension of the centers: 4000 Diracs.
centers = np.array( [ [ -0.5, -0.3, -0.2 ], [ 0.5, -0.2, 0.1 ], [ 0.0, 0.5, 0.3 ] ] )
target = sdot.SumOfGaussians( centers, sigmas = np.array( [ 0.25, 0.15, 0.2 ] ),
                              weights = np.array( [ 1.0, 0.6, 0.8 ] ), support_sigmas = 3 )

x = sdot.quantization( target, 4000, seed = 0 )An image
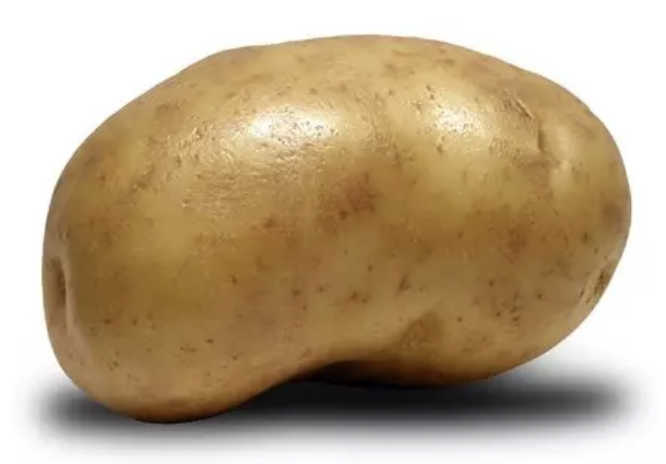
The density is now a piecewise constant image: the brightness of a photo of a potato — the white background is dense, the potato lighter, its shadow almost empty. 4000 Diracs, starting from white noise.
from PIL import Image

img = Image.open( "potato.png" ).convert( "RGBA" )
img = Image.alpha_composite( Image.new( "RGBA", img.size, "white" ), img ).convert( "L" )
img = img.resize( ( img.width // 4, img.height // 4 ), Image.Resampling.LANCZOS )

# sdot.Image indexes the pixels as [ x, y ], y upwards; + 1 keeps the density positive everywhere
values = np.ascontiguousarray( np.asarray( img, dtype = float ).T[ :, ::-1 ] ) + 1.0
target = sdot.Image( values )

x = sdot.quantization( target, 4000, seed = 0 )On a surface
The target can also be carried by a surface in 3D ( or by lines ): sdot.Mesh( nodes, triangles ), here a Klein bottle that crosses itself. The diracs start on the surface; see Lines and Surfaces for the details and the script.
target = sdot.Mesh( nodes, triangles )                  # 2880 triangles in 3D
x = sdot.quantization( target, 6000, seed = 0 )Reproducing the pages
The first four viewers above are written by docs/examples/lloyd_quantization.py ( the bottle, by the script of Lines and Surfaces ):
python docs/examples/lloyd_quantization.py                  # all of them
python docs/examples/lloyd_quantization.py pentagon potato  # or some of them
Each page keeps every iteration.